
EDP2 Starter Code#
Make sure you choose the latest Weekly release when you run this notebook on the RSP. This will give you the latest software versions with bug fixes and performance improvements.
Setup#
[1]:
import lsdb

import astropy.units as u
from astropy.coordinates import SkyCoord
from upath import UPath
import matplotlib.pyplot as plt
import warnings

warnings.filterwarnings("ignore")

plt.rcParams.update(
    {
        "axes.titlesize": 16,
        "axes.labelsize": 15,
        "xtick.labelsize": 13,
        "ytick.labelsize": 13,
        "legend.fontsize": 13,
        "figure.titlesize": 18,
    }
)
[2]:
import logging

logging.getLogger().setLevel(logging.WARNING)
logging.getLogger("distributed").setLevel(logging.WARNING)
[3]:
# Setup
from dask.distributed import Client

client = Client(n_workers=4, memory_limit="4GiB", threads_per_worker=1)
print(f"Dask dashboard: {client.dashboard_link}")
Dask dashboard: https://ncaplar.nb.data-int.lsst.cloud/nb/user/ncaplar/proxy/8787/status
Open catalog#
[4]:
# Open DP2 catalog and plot
# Path on RSP
base_path = UPath("/rubin/lsdb_data")
cat = lsdb.open_catalog(base_path / "object_collection")
cat.plot_pixels();
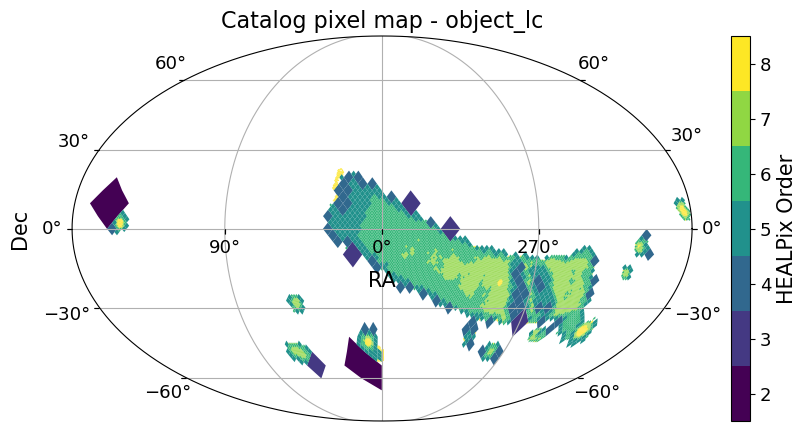
[5]:
# Choose catalog
# Object catalog: "object_collection"
# DiaObject catalog: "dia_object_collection"
cat = (
    lsdb.open_catalog(
        base_path / "object_collection",
        # Select columns
        # Column descriptions available at https://sdm-schemas.lsst.io/dp2.html
        columns=["g_psfMag", "r_psfMag"],
        # Select a sky region
    )
    .cone_search(
        ra=10.0,
        dec=-5.0,
        radius_arcsec=2 * 3600,
        # Query on column values
    )
    .query("g_psfMag < 28.0 and r_psfMag < 28.0")
)
[6]:
# Check catalog
cat
[6]:
lsdb Catalog object_lc:
| g_psfMag | r_psfMag | coord_ra | coord_dec | |
|---|---|---|---|---|
| npartitions=19 | ||||
| Order: 5, Pixel: 4482 | float[pyarrow] | float[pyarrow] | double[pyarrow] | double[pyarrow] |
| ... | ... | ... | ... | ... |
| Order: 6, Pixel: 17971 | ... | ... | ... | ... |
| Order: 6, Pixel: 17976 | ... | ... | ... | ... |
4 out of 1261 available columns in the catalog have been loaded lazily, meaning no data has been read, only the catalog schema
This catalog has an estimated size of 54.1 MB
Plot skymaps#
[7]:
# Plot catalog
cat.plot_pixels();
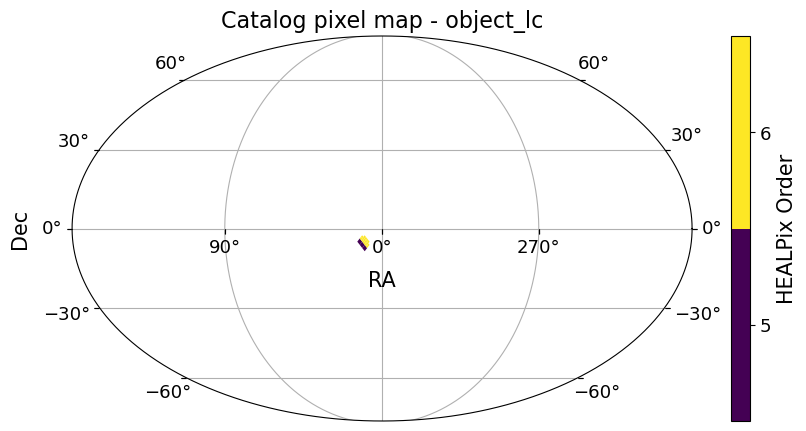
[8]:
# Plot zoomed catalog
import astropy.units as u

fov = (8 * u.deg, 8 * u.deg)
center = SkyCoord(10 * u.deg, -5 * u.deg)
fig, ax = cat.plot_pixels(projection="AIT", fov=fov, center=center);
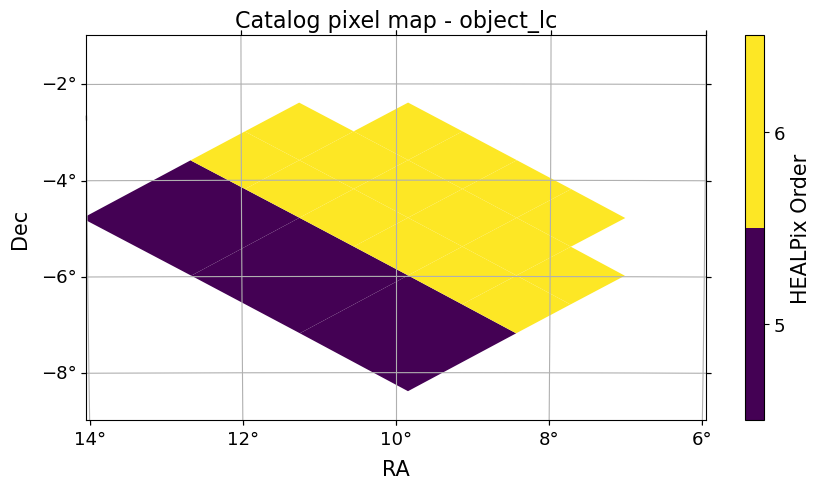
[9]:
# Plot density
import hats

hats.inspection.plot_density(cat.hc_structure, ec="face", projection="AIT", fov=fov, center=center);
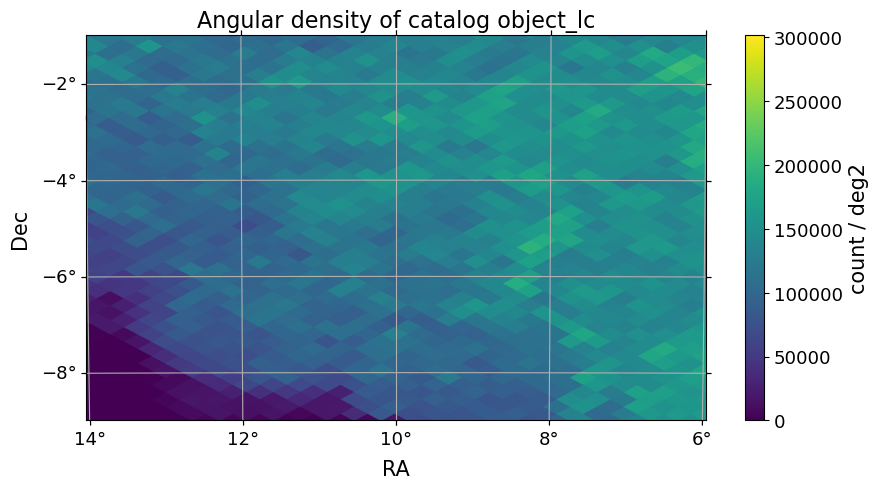
Map a function#
[10]:
# Map a function


# The mappable function takes in a dataframe that represents a partition.
# It returns a dataframe.
def g_minus_r_mapper(df):
    df["g_minus_r_mag"] = df["g_psfMag"] - df["r_psfMag"]
    return df


cat = cat.map_partitions(g_minus_r_mapper)
Compute catalog#
[11]:
# Check catalog before computing
cat.head()
[11]:
| g_psfMag | r_psfMag | coord_ra | coord_dec | g_minus_r_mag | |
|---|---|---|---|---|---|
| _healpix_29 | |||||
| 1261770054783963537 | 23.567427 | 27.750866 | 9.387727 | -6.903804 | -4.183439 |
| 1261770060486994182 | 25.459435 | 25.13032 | 9.386266 | -6.903903 | 0.329115 |
| 1261770060491471999 | 23.589426 | 24.084002 | 9.386552 | -6.903749 | -0.494576 |
| 1261770060628372753 | 23.302301 | 25.299643 | 9.385689 | -6.903057 | -1.997341 |
| 1261770062830375321 | 25.315023 | 25.074331 | 9.383639 | -6.900418 | 0.240692 |
5 rows × 5 columns
[12]:
# Compute catalog and write to disk
cat.write_catalog("dp2_example_cat", overwrite=True)
[13]:
# Compute catalog to dataframe
df = cat.compute()
[14]:
df
[14]:
| g_psfMag | r_psfMag | coord_ra | coord_dec | g_minus_r_mag | |
|---|---|---|---|---|---|
| _healpix_29 | |||||
| 1261770054783963537 | 23.567427 | 27.750866 | 9.387727 | -6.903804 | -4.183439 |
| 1261770060486994182 | 25.459435 | 25.13032 | 9.386266 | -6.903903 | 0.329115 |
| ... | ... | ... | ... | ... | ... |
| 1264957488779219710 | 23.485807 | 23.111719 | 9.642696 | -3.406365 | 0.374088 |
| 1264957490399993435 | 23.47562 | 22.966101 | 9.636538 | -3.40503 | 0.50952 |
646908 rows × 5 columns
[15]:
# Read catalog from disk
cat = lsdb.open_catalog("dp2_example_cat")
Crossmatch#
[16]:
# Crossmatch
des_cat = lsdb.open_catalog("s3://stpubdata/mast/public/des/hats/des_dr2/", columns=["MAG_AUTO_G"])
des_cat
[16]:
lsdb Catalog des_dr2:
| MAG_AUTO_G | RA | DEC | |
|---|---|---|---|
| npartitions=1582 | |||
| Order: 4, Pixel: 0 | double[pyarrow] | double[pyarrow] | double[pyarrow] |
| ... | ... | ... | ... |
| Order: 6, Pixel: 47556 | ... | ... | ... |
| Order: 1, Pixel: 47 | ... | ... | ... |
3 out of 215 available columns in the catalog have been loaded lazily, meaning no data has been read, only the catalog schema
This catalog has an estimated size of 22.1 GB
[17]:
des_cat.plot_pixels();
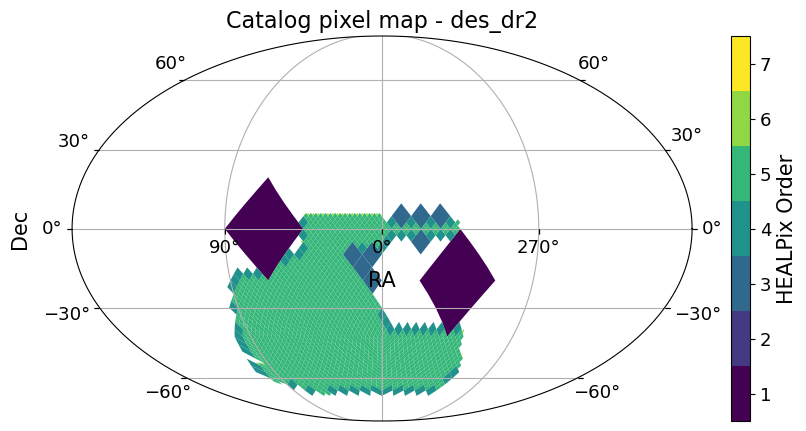
[18]:
# Crossmatch Rubin DP2 catalog with DES catalog
x_cat = cat.crossmatch(
    des_cat,
    suffix_method="overlapping_columns",
)
[19]:
x_cat.head()
[19]:
| g_psfMag | r_psfMag | coord_ra | coord_dec | g_minus_r_mag | MAG_AUTO_G | RA | DEC | _dist_arcsec | |
|---|---|---|---|---|---|---|---|---|---|
| _healpix_29 | |||||||||
| 1261772975348269355 | 22.824999 | 21.217491 | 9.354591 | -6.763164 | 1.607508 | 22.549606 | 9.354593 | -6.763168 | 0.016437 |
| 1261772979210506070 | 23.712337 | 22.337854 | 9.343584 | -6.76523 | 1.374483 | 22.570774 | 9.343664 | -6.765238 | 0.288975 |
| 1261772981394880982 | 25.01685 | 23.876198 | 9.35136 | -6.762464 | 1.140652 | 24.032064 | 9.351434 | -6.76249 | 0.281369 |
| 1261772981413236414 | 22.785107 | 21.315828 | 9.350297 | -6.763012 | 1.469278 | 22.043205 | 9.350302 | -6.763015 | 0.022969 |
| 1261772981529417225 | 23.926285 | 22.162642 | 9.350745 | -6.761828 | 1.763643 | 23.699547 | 9.350747 | -6.761827 | 0.007049 |
5 rows × 9 columns
[20]:
x_cat.plot_pixels(projection="AIT", fov=fov, center=center);
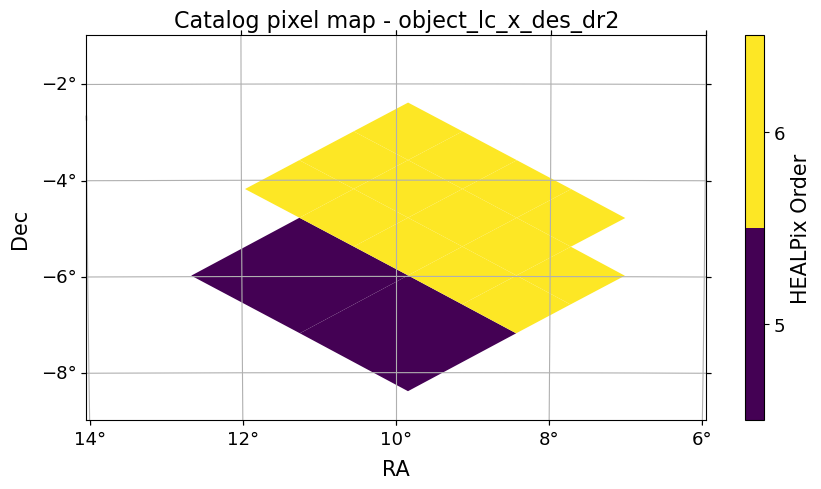
[21]:
x_df = x_cat.compute()
[22]:
x_df
[22]:
| g_psfMag | r_psfMag | coord_ra | coord_dec | g_minus_r_mag | MAG_AUTO_G | RA | DEC | _dist_arcsec | |
|---|---|---|---|---|---|---|---|---|---|
| _healpix_29 | |||||||||
| 1261772975348269355 | 22.824999 | 21.217491 | 9.354591 | -6.763164 | 1.607508 | 22.549606 | 9.354593 | -6.763168 | 0.016437 |
| 1261772979210506070 | 23.712337 | 22.337854 | 9.343584 | -6.76523 | 1.374483 | 22.570774 | 9.343664 | -6.765238 | 0.288975 |
| ... | ... | ... | ... | ... | ... | ... | ... | ... | ... |
| 1264957488779219710 | 23.485807 | 23.111719 | 9.642696 | -3.406365 | 0.374088 | 23.457121 | 9.6427 | -3.406363 | 0.017579 |
| 1264957490399993435 | 23.47562 | 22.966101 | 9.636538 | -3.40503 | 0.50952 | 22.97908 | 9.636515 | -3.405052 | 0.116141 |
497892 rows × 9 columns
[23]:
mag_lo, mag_hi = 16.0, 28.0

fig, ax = plt.subplots(figsize=(8, 7.5))
hb = ax.hexbin(
    x_df["g_psfMag"],
    x_df["MAG_AUTO_G"],
    gridsize=55,
    bins="log",
    extent=(mag_lo, mag_hi, mag_lo, mag_hi),
    mincnt=1,
    cmap="viridis",
)
ax.plot([mag_lo, mag_hi], [mag_lo, mag_hi], "r--", lw=1)
cb = fig.colorbar(hb, ax=ax, pad=0.02)
cb.set_label("log$_{10}$ count")

ax.set_xlim(mag_hi, mag_lo)
ax.set_ylim(mag_hi, mag_lo)
ax.set_aspect("equal")
ax.set_xlabel("$g$ psf magnitude (Rubin DP2)")
ax.set_ylabel("$g$ auto magnitude (DES)")
ax.set_title("$g$ magnitudes, Rubin DP2 vs DES")

fig.tight_layout()
plt.show()
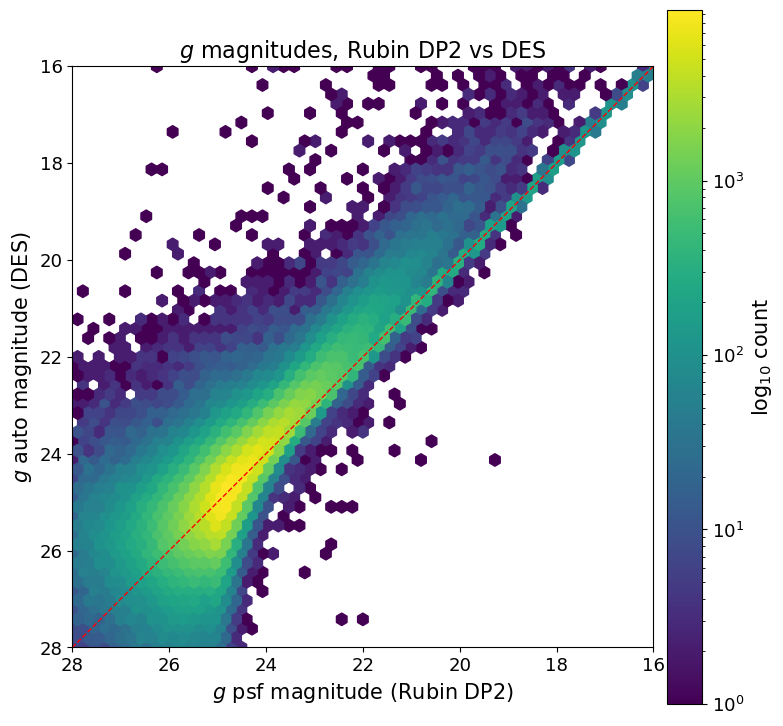
[24]:
# Clean up
client.close()
About#
Authors: Heather Sestili
Last run: July 27, 2026
If you use lsdb for published research, please cite following instructions.